
Figure 6.
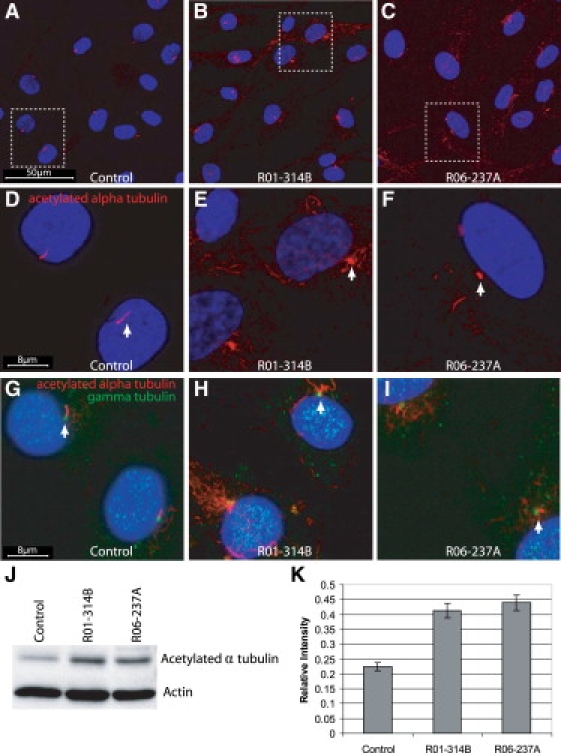
SRP Chondrocytes Have Abnormal Primary Cilia and Increased Levels of Acetylated α-tubulin
(A and D) Immunofluorescence for acetylated α-tubulin (red) and DAPI (blue) in primary chondrocytes shows normal presentation of cilia in control cells. Chondrocytes from R01-314B (B and E) and R06-237A (C and F) show abnormal cilia and increased amounts of cytoplasmic acetylated α-tubulin. (D–F) Higher-magnification views of the boxed regions in (A)–(C). Cilia length measured an average of 3.2 ± 0.57 μm in control cells and 1.9 ± 0.44 μm in SRP chondrocytes (p, 0.01, Student's t test). (G–I) Immunofluorescence for acetylated α-tubulin (red), γ tubulin (green), and DAPI (blue) shows the presence of a basal body in both control and SRP chondrocytes. (J) Immunoblot analysis of acetylated α-tubulin expression in control, R01-314A, and R06-237B chondrocytes showed an increase of acetylated α-tubulin expression in mutant chondrocytes compared to the control. β-actin was used as a protein loading control. (K) Quantitation of the ratio of acetylated α-tubulin relative to β-actin from the immunoblots (n = 4) demonstratied about a 2-fold increase in the relative level of acetylated α-tubulin in mutant chondrocytes compared to the normal control. Vertical bars indicate the standard deviation.