
Figure 1.
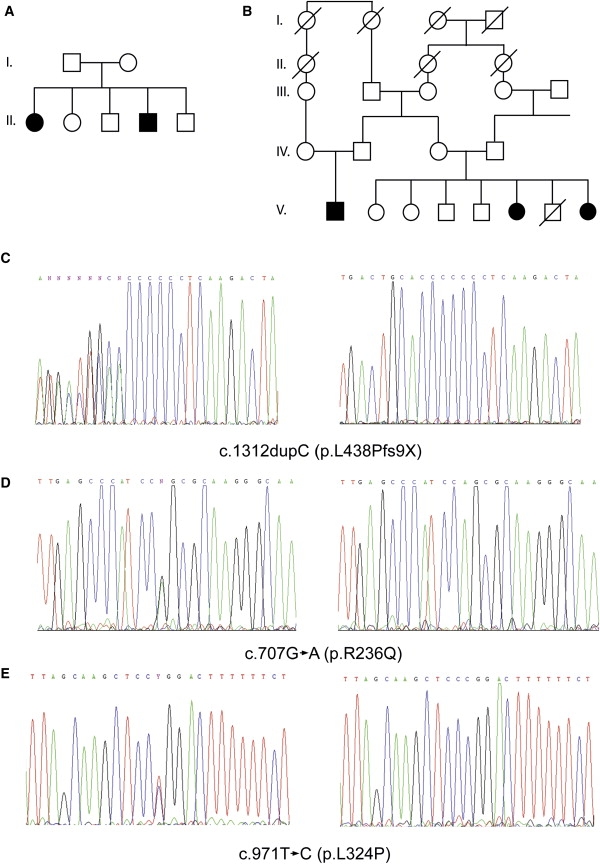
Pedigrees of Family A and B and Electropherograms
(A and B) Pedigree of family A (A) and B (B). Filled symbols represent affected individuals, and open symbols represent unaffected individuals.
(C–E) Partial electropherograms of heterozygous (left) and homozygous (right) patients from family A showing the c.1312 dupC, family B showing the c.707G→A (p.R236Q), and family C showing the c.971T→C (p.L324P) mutations in CNNM4, respectively.