
Figure 3.
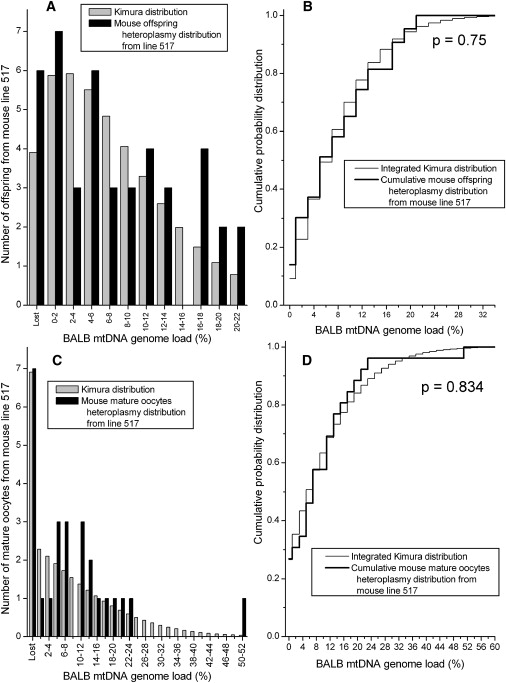
The Measured Heteroplasmy Distribution from Offspring and Mature Oocytes in the Heteroplasmic Mouse Line 517 Is Compared to the Kimura Distribution
(A) The heteroplasmy frequency histogram from the offspring.
(B) KS test comparing the offspring heteroplasmy data to the Kimura distribution fit to the data.
(C) The heteroplasmy frequency histogram of the mature oocytes in the 517 line.
(D) KS test for the data from line 517 mature oocytes.