
Figure 6.
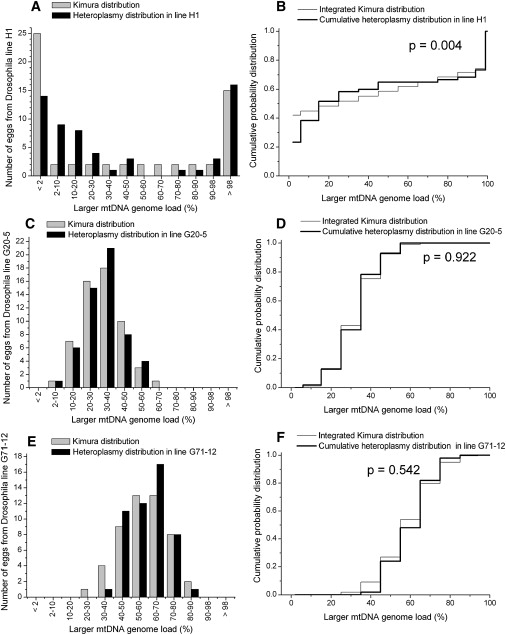
The Measured Heteroplasmy Distribution from Unfertilized Eggs in the Heteroplasmic Drosophila mauritiana Lines H1, G20-5, and G71-12 Is Compared to the Kimura Distribution
(A) The heteroplasmy frequency histogram of the Drosophila line H1 and the Kimura distribution fit to the mean and variance values from these data.
(B) The KS test comparing the data with the Kimura distribution. There is a significant difference between the two distributions for line H1.
(C) The heteroplasmy frequency histogram for the Drosophila line G20-5 is compared to the Kimura distribution.
(D) KS test comparing the data for Drosophila line G20-5 to the Kimura distribution.
(E) The heteroplasmy frequency histogram from the Drosophila line G71-12 is compared to the Kimura distribution.
(F) KS test comparing the data for Drosophila line G71-12 to the Kimura distribution.