
Figure 1.
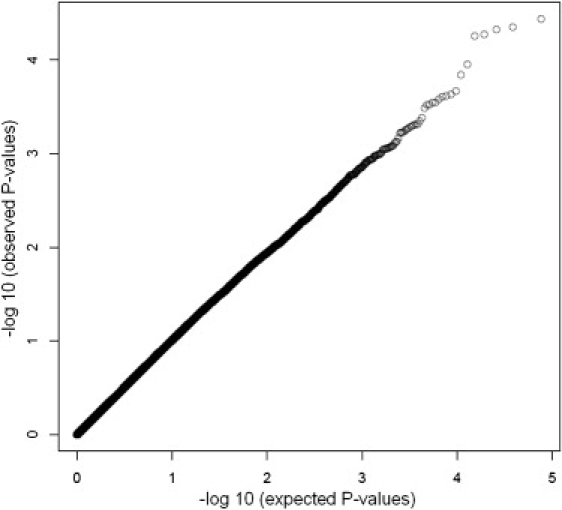
Q-Q Plot of Markers Tested in the GWA Screening Phase
Distribution of FBAT-GEE p values for all 404,604 SNPs on the 500K array with ≥20 informative families as Q-Q plot depicting observed versus expected p values.
Official websites use .gov
A
.gov website belongs to an official
government organization in the United States.
Secure .gov websites use HTTPS
A lock (
) or https:// means you've safely
connected to the .gov website. Share sensitive
information only on official, secure websites.
Q-Q Plot of Markers Tested in the GWA Screening Phase
Distribution of FBAT-GEE p values for all 404,604 SNPs on the 500K array with ≥20 informative families as Q-Q plot depicting observed versus expected p values.