
Figure 1.
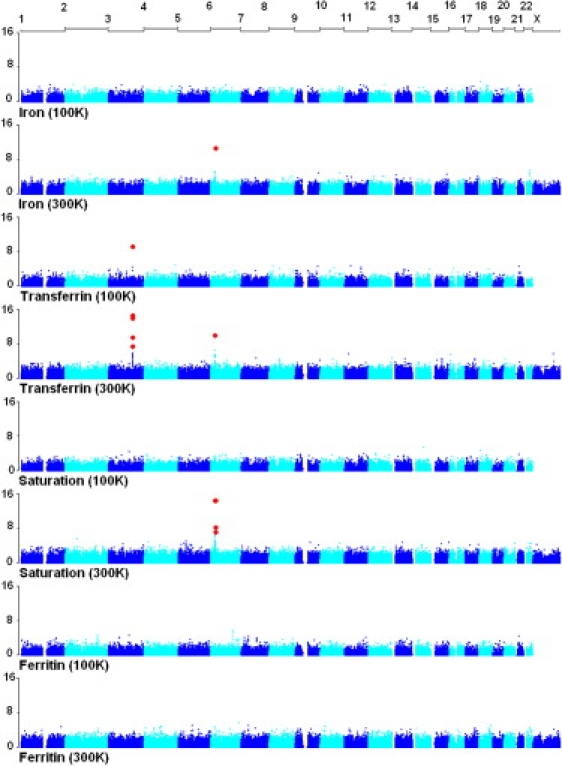
GWAS Results for Iron Status in the 100K and 300K Studies
On the x and y axis are chromosome number and −log10(p) value, respectively. Red dots indicate the SNPs that reached genome-wide significance (p < 0.05) after a Bonferroni correction for multiple testing.