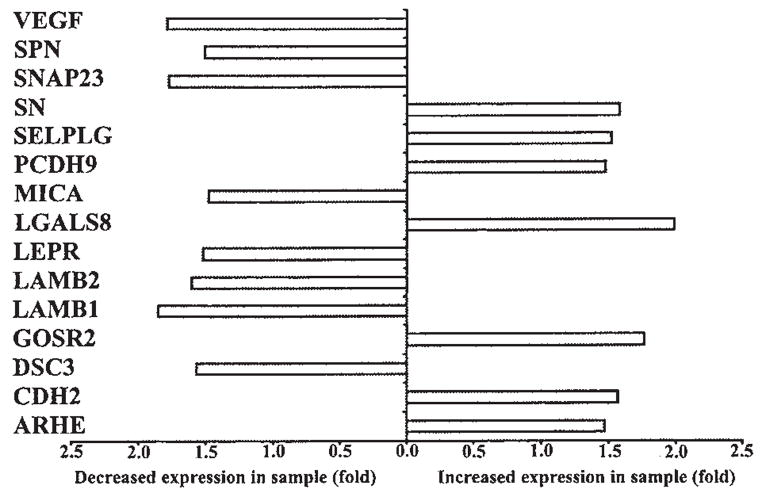
FIG. 6.
Graph illustrating the differential expression of genes involved in cell adhesion in control and p12I-expressing Jurkat T cells from gene array. A difference of at least 1.5-fold between control and sample was considered significant. Gene symbols are given on the left side of the graph. The complete list of genes modulated by p12I is given as a table elsewhere (www.vet.ohio-state.edu/docs/retrovirus.html). The supplement material includes probe set ID of the gene used in Affymetrix HG-U133A gene chip, name of the gene, gene symbol, and chromosome map location of each gene.

