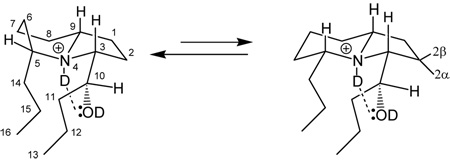
Table 2.
1H-NMR Assignments for 239Q (1) in d6-acetone.
 | |||||
|---|---|---|---|---|---|
| H-# | δ (m, J (Hz))a | 1D-irradiation at H-# affects signal at δ |
1D-irradiation at δ affects signal at H-# |
TOCSY Cross-peaks |
NOESY Cross-peaks |
| 1 | 2.32 J=lg. | ||||
| 2 | 1.78 J=lg ; 2.32, J=sm. (2β, 2α respectively) | ||||
| 3 | 3.73 dd (10.4, 2.6) | 1.83, 1.88–1.93; 2.16–2.21 2.32 (sm. J removed) | 1,52–1.56; 1.77, 1.88–1.89; 2.16–2.23; 2.32 | 1.9 [1.95, 2.0, 2.2, 2.32 3.13] | H3-H9; H3-H10 |
| 4 NH, 6d | 10.7 broad s | ||||
| 5 | 3.12 dddd (12.0, 10.8, 3.0, 1.5) appears as br. t | 2.26–2.35 removes lg. J (t→d), 1.91, 1.74–1,82 (removes lg. J) | 1.75–1.77, 1.89, 2.16–2.23. | 2.32 [1.6, 1.8, 1.9, 1.95, 2.0, 2.2] | |
| 6 | 1.78, 2.32 | 1.91–1.94; 2.28–2.34 | 1.89; 2.16–2.23 | 1.8, 2.2 | |
| 7/8 | 2.32 | 1.95, 2.20 | |||
| 9 | 3.25 dddd (11.6, 11.3, 3.0, 2.8) | 2.21–2.26, sm. J with H-3 removed at δ 2.17–2.21 [dd→d; “U”-type coupling?] 2.32 two lg. Js removed. | 1.76–1.81; 1.92; 2.17–2.23; | 1.95, 2.22 [1.6, 1.9, 2.04, 2.32] | H9-H3 |
| 10 | 4.19, 4.2 (3:2, d, J=8.5) | 1.33–1.38 (→s), 1.48–1.5 (dd→d) | 1.33–1.38; 1.46–1.52; | 1.4 [1.5] | H10-H3 |
| 11 | 1.36–1.4; 1.49–1.5 | 1.48–1.52 | |||
| 12 | 1.48–1.52 (A) 1.28–1.31 (B) | ||||
| 13 | 0.93 (A, B); J=7.3 | 1.52–1.55 | 1.52–1.55 | 1.55 | |
| 15 | 1.40 | ||||
| 16 | 0.89 (A); 0.93 (B) 1:2, t J=7.3 | 1.37–1.38 | 1.47–1.52 | 1.5, 1.78, 2.12 | |
| OH, 6 d | 5.75; 5.8 3:2 (J=5,1) | ||||
s, singlet; d, doublet; t, triplet; br., broad; 6d, spectra on back-exchanged alkaloid after 6 days.; lg,, large J; sm,, small J; tocsy data in brackets are for the longest mixing time (0.05 sec); other data is for 0.002 sec.
