
Fig. 2.
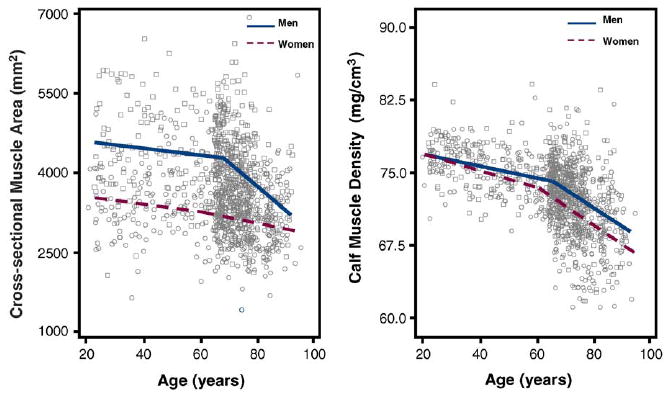
Scatter plots of the calf cross-sectional muscle area and muscle density according to age in both sexes. Relationships are summarized by plotting expected values from piecewise adjusted models. Single values are plotted as circles for men and squares for women.