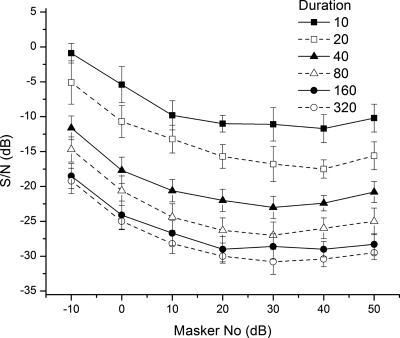
Figure 2.
NoSπ threshold S∕N (in dB) plotted as a function of the spectrum level of the broadband (100–3000 Hz) Gaussian noise masker. The data represent the thresholds averaged across four listeners. Error bars represent ±1 standard error of the mean. The parameter of the plot is the masker∕signal duration.

