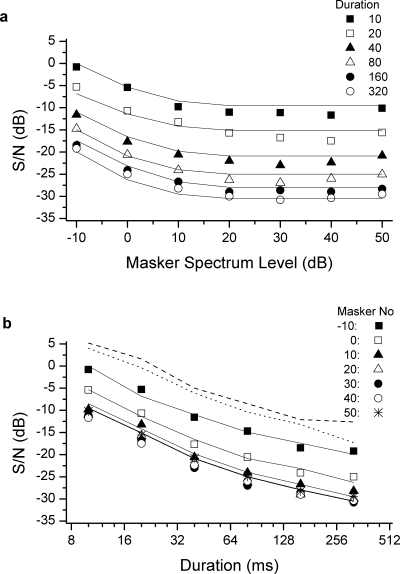
Figure 5.
Panels a and b contain a re-plotting of the data (symbols) depicted in Figs. 23, respectively. The predictions of the data derived from an iterative computational procedure (see text) are indicated by the solid lines. The parameter of the plot in each panel is the masker∕signal duration. The dotted and dashed lines in panel b represent the So and Sπ quiet thresholds, respectively, replotted from Fig. 1.

