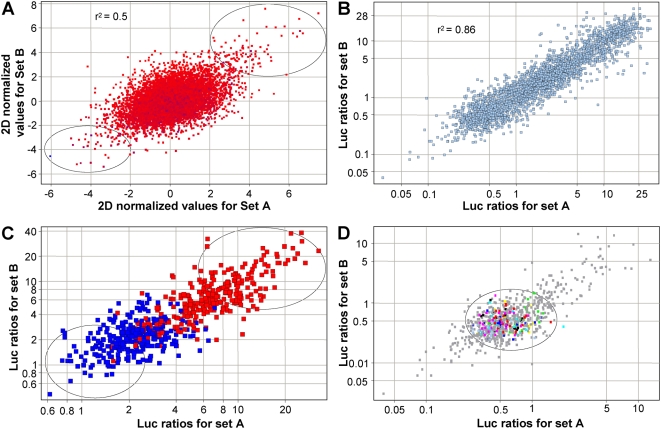
Figure 2. Primary and secondary screen results.
(A) Scatter plot showing the result from the primary screening of 10,000 putative full-length human cDNA's in the SREBP cleavage assay. The 2D-normalized z-scores for a clone in the first experiment (x-axis) are plotted against that obtained in the second experiment (y-axis). Genes at the top right corner represent potential activators of SREBP signaling, while those at the bottom left corner represent potential repressors of SREBP signaling (circles). (B) Scatter plot representing the combined data from all secondary screens. Each clone was re-tested in triplicate in two separate experiments. Firefly to renilla luciferase ratios for a clone in the first experiment (x-axis) were plotted against the ratios for the same clone in the second experiment (y-axis). (C) Analysis of the selected 176 clones under conditions identical to those used in the primary screen. Scatter plot shows luciferase ratios obtained for a clone in the first experiment against ratios obtained for the same clone in the second experiment. Activators are represented in red and repressors in blue. Circles represent clones displaying the highest activation or repression of luciferase ratios. (D) Effect of the 176 selected activators and suppressors (grey points) on mutant SRE promoter. The scatter plot shows the luciferase ratios obtained for a clone in the first experiment against luciferase ratios obtained in the second experiment. Central data points (circle) represent genes that did not have an effect on the mutant SRE-luciferase. Grey points falling at the extremities represent clones that activated the mutant SRE-luciferase or had higher levels of renilla luciferase. Control genes are color coded as: red, DN-SCAP; dark blue, DP-SCAP; yellow, INSIG1; black, SCAP; green, pSport6; sky blue, pXL4; pink, pcDNA3.

