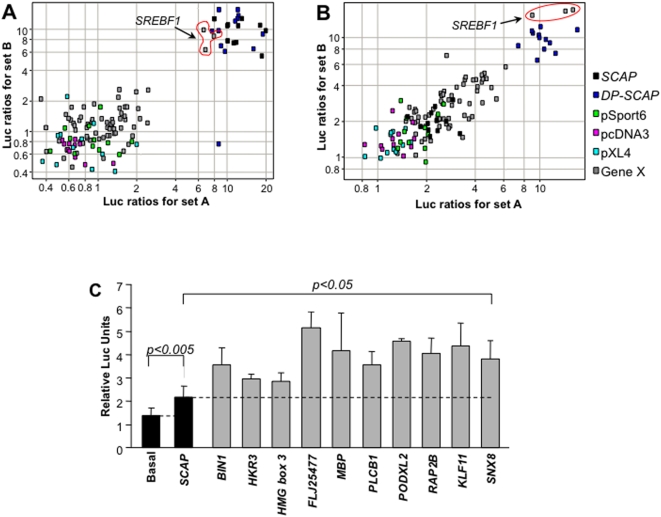
Figure 4. Novel activators of the SREBP pathway.
(A) Effects of activator genes in presence of 25-OH cholesterol. The cDNA's were assayed in the presence of 1 µg/ml 25-hydroxy cholesterol. Scatter plot shows the luciferase ratios obtained for a clone in the first experiment against that obtained in the second experiment. Data points lying at the bottom left corner of the scatter plot represent genes that do not activate SRE-luciferase in the presence of high cholesterol. SCAP (black points), DP-SCAP (dark blue points) and SREBF1 overcome cholesterol repression (top right corner). Empty vectors color coded as: green, pSport6; sky blue, pXL4; pink, pcDNA3. (B) Effects of INSIG1 overexpression (15 ng/well) on novel activator genes. SCAP (central black points), DP-SCAP (dark blue points) and SREBF1 (top right corner) escape repression by INSIG1. In addition, a number of candidate genes (grey points) activated SRE-luciferase to a greater extent than SCAP. Colored points represent empty vectors: green, pSport6; sky blue, pXL4; pink, pcDNA3. (C) Graphical representation of the ten novel activator genes that activate SREBP signaling under high INSIG1 levels. These genes activate the SREBP signaling assay to a significantly greater extent than SCAP (Student's t-Test, p<0.005 or p<0.05).

