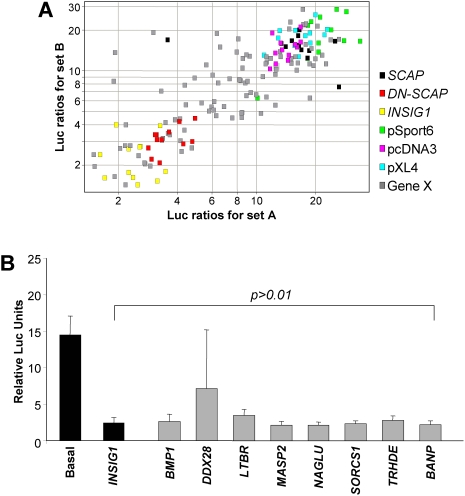
Figure 5. Novel repressors of the SREBP pathway.
(A) Effects of SCAP (15 ng/well) over-expression on novel repressor genes. Scatter plot depicting the luciferase ratios obtained for a clone in the first experiment against ratios obtained in the second experiment. Internal control genes are color coded as: yellow, INSIG1; red, DN-SCAP; green, pSport6; sky blue, pXL4; pink, pcDNA3. (B) Graphical representation of eight repressors that can inhibit SCAP-mediated SREBP activation as efficiently as INSIG1 (Student's t-Test, p>0.01).

