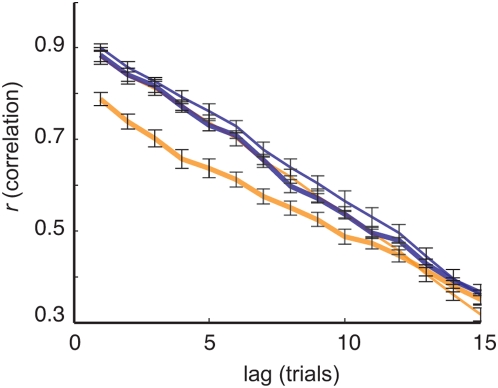
Figure 3. Serial correlations between response times (RTs).
Average of correlations for 16 sites of monkeys A and B. The different correlations estimated from sequences preceding (thin line) or following injections (thick line) of GABAA agonist (blue line) and antagonist (orange line) are plotted separately. The correlations between RTs and past RTs are presented at lags up to 15 trials.

