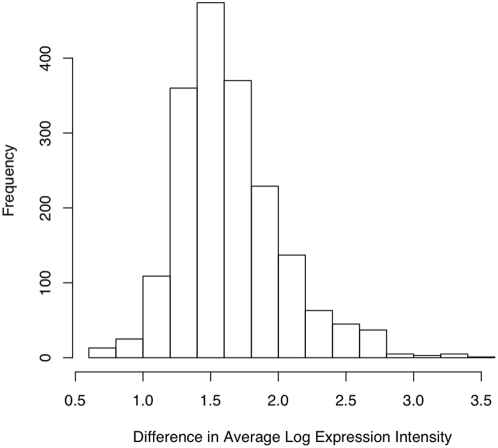
Figure 2. Probes with improved detection have higher expression intensity in post-globin reduction data compared to pre-globin reduction.
The histogram shows the distribution of the difference in average log-reduced intensities between the post-globin reduction and pre-globin reduction data for the probes with improved detection p-values. Most of the improved probes show at least two-fold increase in average expression intensity in the post-globin reduction data.

