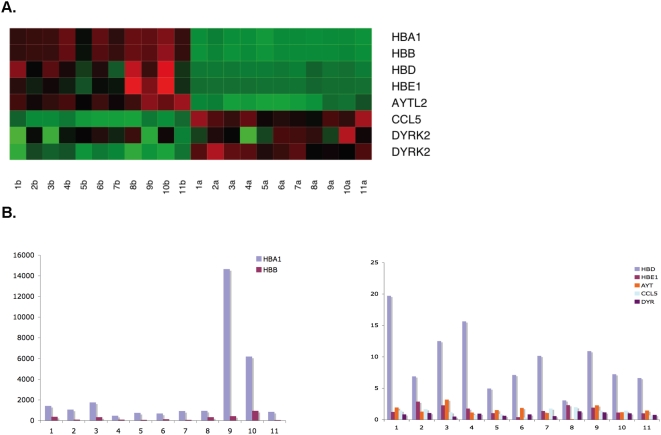
Figure 5. Real-time PCR evaluations of genes identified as differentially expressed between pre- and post-globin reduction samples in the microarray data.
A. A heatmap showing seven of the genes in 11 samples differentially expressed between the pre- and post-globin reduction samples in the BeadArray data. B. The four hemoglobin genes were significantly reduced and no other gene was markedly changed by globin reduction in real-time PCR data. The X-axis represents 11 samples and Y-axis represents the gene expression ratio of pre-globin reduction to post-globin reduction.

