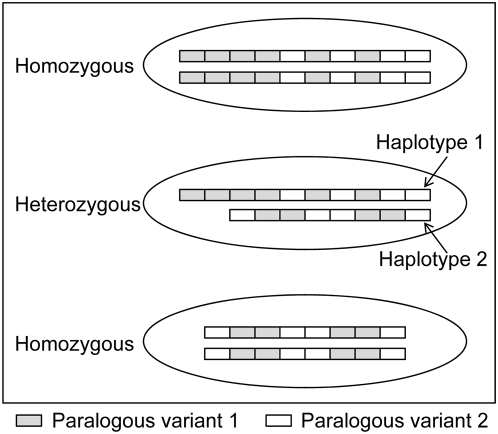
Figure 1. Schematic illustration of genotypes, haplotypes, and paralogous variants.
Cells with three different genotypes comprised of two haplotypes are shown. The top and bottom cells are homozygous for either the longer or shorter haplotype, while the cell in the middle has both. Each haplotype has two paralogous variants that are distinguished by grey and white colors, and discriminated by analyzing a single-base substitution experimentally. Each variant may have zero to multiple copies.

