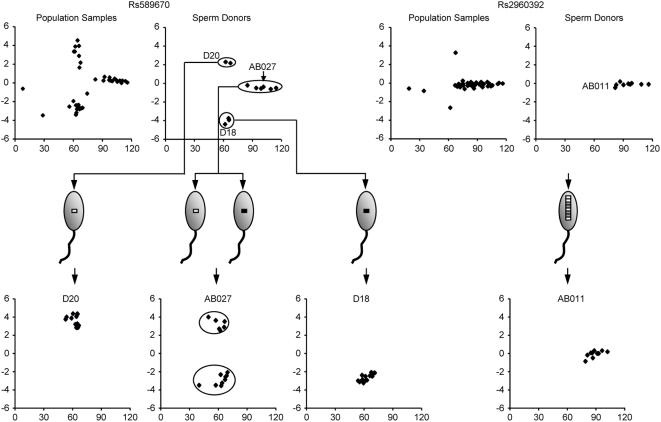
Figure 2. Correlation between genotypes of the donors and their sperm samples for SNP Rs589670 and CNV Rs2960392.
Donor genotypes were determined using the corresponding semen samples. For all scatter plots: x-axis, the sum of the signal intensities/1,000 of the two colors, y-axis, Ln(R)s. Allelic variants of the SNP are diagrammed as light grey and black strips in the sperm heads, and CNV paralogous variants are indicated as white and darker grey strips.

