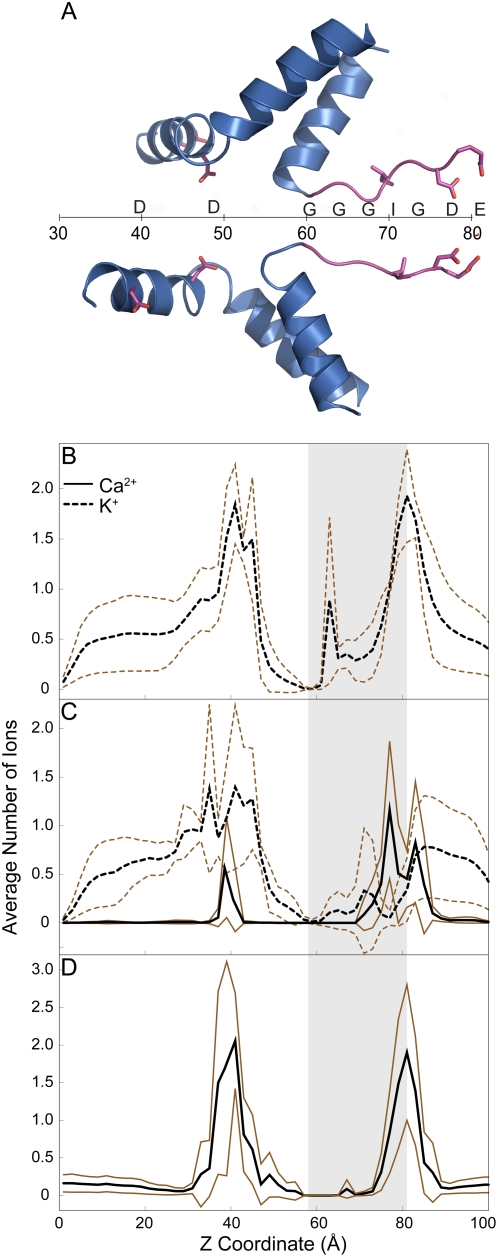
Figure 3. Histogram of ion occupancies along the axis of the channel.
(A) Schematic of the pore axis and the positions of residues along the pore axis. (B) RyR1-WT in 250 mM KCl. (C) RyR1-WT in 250 mM KCl and 70 mM CaCl2. (D) RyR1-WT with 125 mM CaCl2. The region corresponding to selectivity filter is shaded in the plots. This region was determined from the distribution of z coordinates of Cα of G4894 and the carboxyl group of E4900 from each of the simulations. The average occupancy from 4 simulations is plotted in black, while lines corresponding to ±1 SD are plotted in brown.

