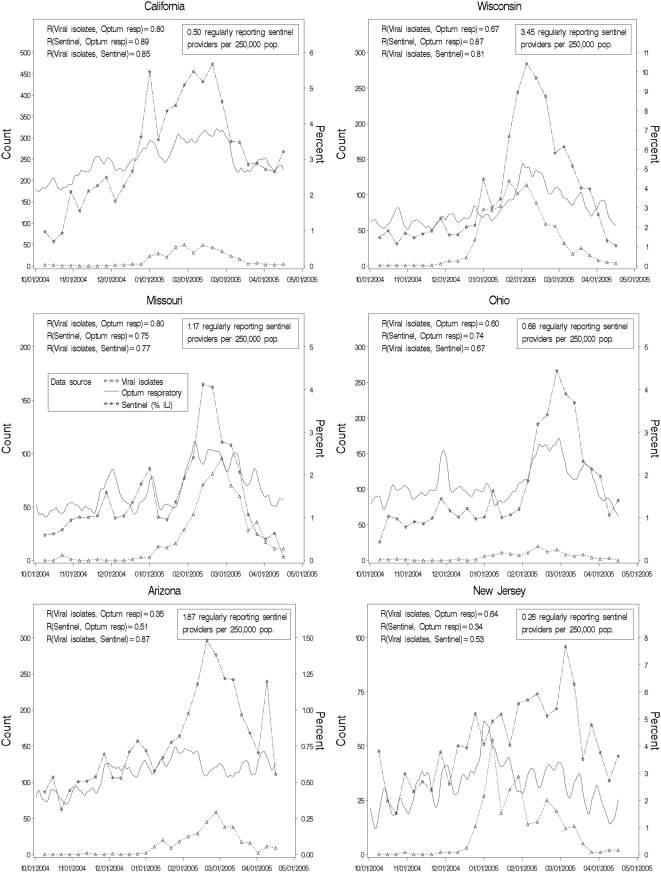
Figure 2. Weekly CDC influenza isolates, CDC percentage ILI from sentinel providers, and Optum respiratory-syndrome call volume.
The selected states are the two with the highest correlations between CDC sentinel provider data and call data (California and Wisconsin), the two with the lowest correlations (Arizona and New Jersey), and the two in the middle of the range (Missouri and Ohio).

