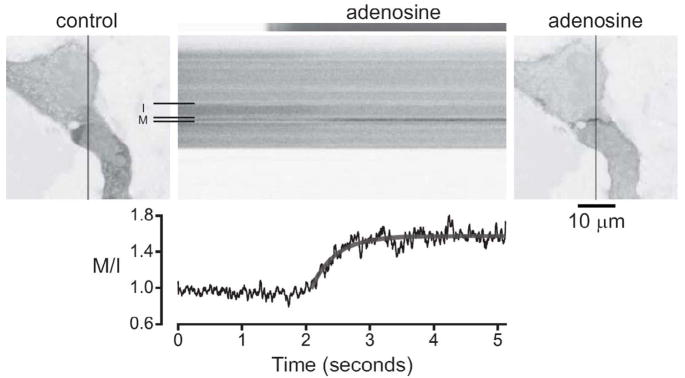
Figure 3.
GRK3ct-V is rapidly translocated to the plasma membrane. Confocal images of HEK 293 cells expressing GRK3ct-V, A1Rs, Gagr;oA and Gβγ are shown before (control) and after (adenosine) application of 30 μM adenosine. Line scanning was performed during the experiment (shown in the center panel) to capture translocation of GRK3ct-V from intracellular (I) to membrane (M) compartments (indicated by the horizontal lines) with high temporal resolution. The adenosine solution exchange time was measured by performing an identical series of line scans during perfusion with a fluorescent dye (shown at the top of the center panel). The graph shows the M/I intensity ratio as a function of time, scaled to correspond to the scan series. The smooth line was generated by fitting the rising phase of the translocation to an exponential function. Vertical lines in the images indicate the position of the line scan; an inverted grayscale lookup table is used to enhance contrast and clarity.

