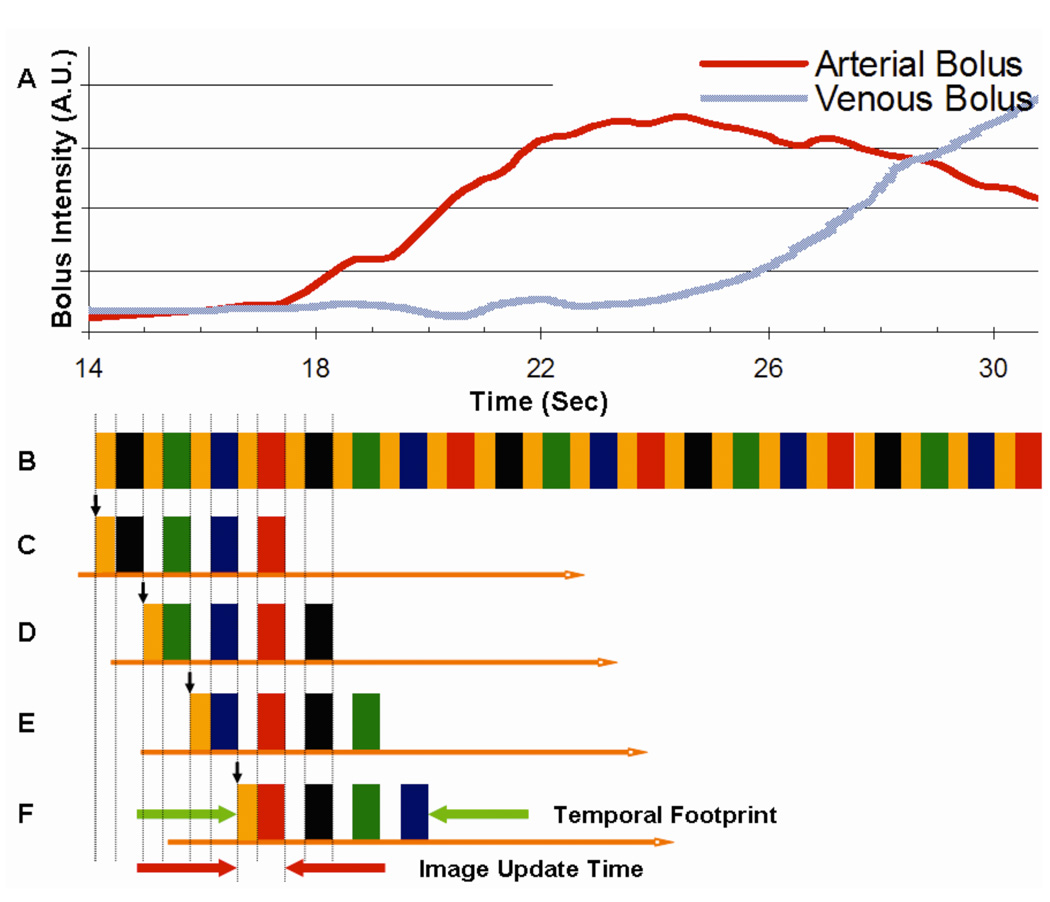
Figure 2.
A schematic showing (A) hypothetical arterial and venous contrast bolus time intensity profiles; (B) Extended playout of sampling pattern of Fig. 1D; (C–F) Selection of view playout of (B) indicating which data are used to reconstruct the first four timeframes. Vertical arrow for each indicates the time to which the corresponding image is assigned. Timings shown approximately correspond to Acq. 14 of Table 1.

