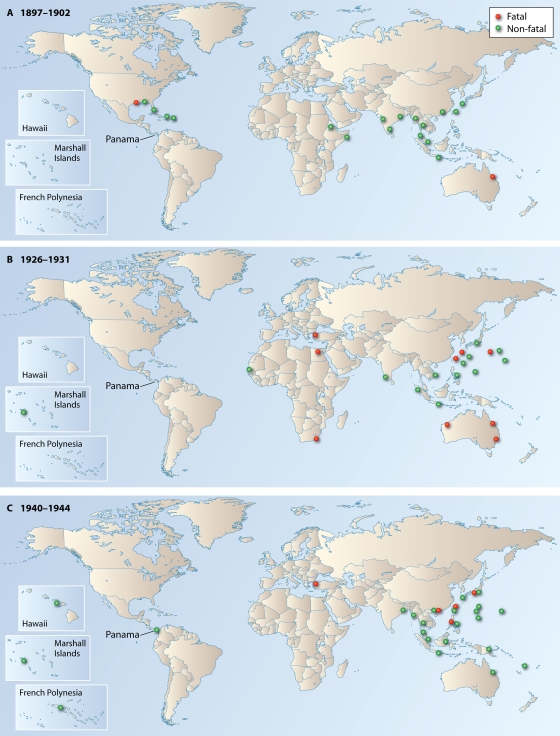
FIG. 1.
Geographic locations of outbreaks of dengue and/or dengue-like illness, clustered in three 5-year periods. The fatal outbreak data used for this figure are based on Table 2, while the outbreaks without a fatality were derived from four sources (21, 49, 78, 137). Clustered outbreaks are shown in panels A (1897 to 1902), B (1926 to 1931), and C (1940 to 1944). The pattern of dengue spread and magnitude of morbidity/mortality in cluster C are most likely “unnatural” because of WWII and disrupted epidemiologic surveillance/reporting in many locations. Between clusters, dengue outbreaks occurred, but the numbers of fatal outbreaks were small in these intercluster periods. Red circles, outbreaks with mortality; green circles, outbreaks without a fatality. One circle (red or green) represents one or more than one outbreak superimposed, but the number of circles per location is not an indicator of the magnitude of outbreaks.

