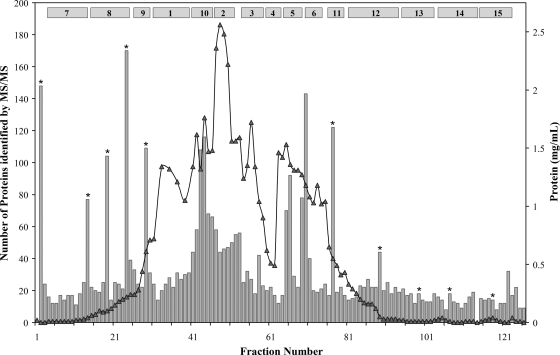
Fig. 2.
Protein elution profile (line) of the c1 column showing the number of proteins identified in each fraction (bars) and the fraction pools (numbered boxes) generated for second level (c2) column fractionation. Fractions that were analyzed by both CV and HT MS/MS are indicated by an asterisk, and the total number of proteins identified by both methods is given.

