
Figure 3.
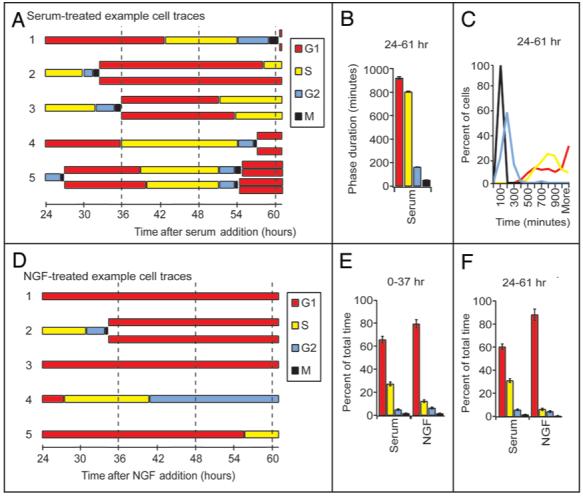
Serum and NGF treated PC12 cells have a marked difference in cell cycle progression. (A) Representative traces of PC12 cells serum starved for 24 hours then treated with serum and imaged after 24 hours for the next 37 hours. (B) Average phase durations of the PC12 cells (shown in A) were tabulated when at least one frame of the preceding and one from the following phase was clearly identified. Error bars are s.d. (C) Histograms of the number of minutes spent in each of the cell cycle phases for the PC12 cells described in (A). (D) Representative traces of PC12 cells serum starved for 24 hours then treated with NGF and imaged after 24 hours for the next 37 hours. The number of frames spent in each phase divided by the total number of frames counted for all cells imaged for 0-37 hours (E) or 24-61 hours (F) post-NGF or serum addition.