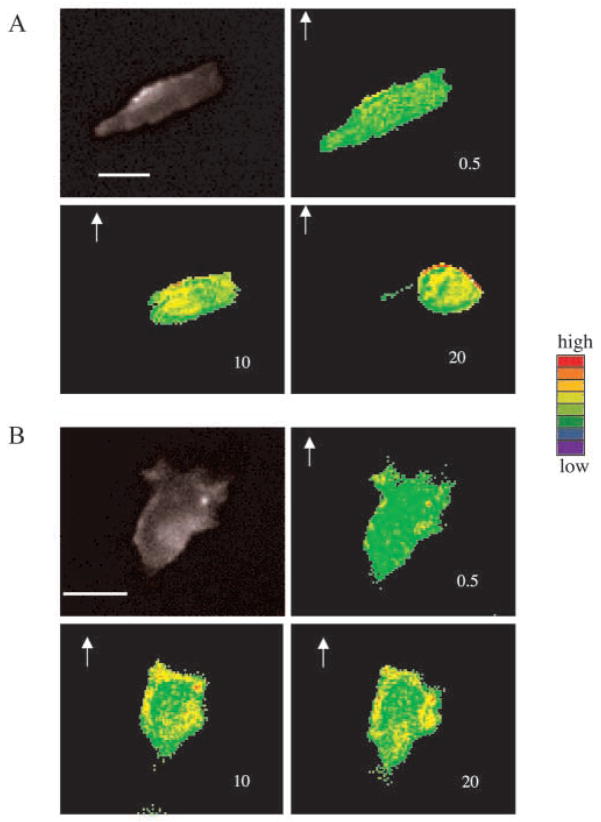
Fig. 4.
FRET images of Rac1 in chemotaxing cells. Membrane-bound Rac1 activities were tested by FRET assay in HEK 293 cells expressing (A) WT or (B) LLKIL mutant CXCR2. FRET images were made as ratio images from two different fluorescent images and plotted with pseudocolor (red, highest activity; blue, lowest activity. Although the overall activities were increased in both types of cells expressing either receptor, the distribution of Rac1 activities was only polarized to the leading pseudopod in WT CXCR2-expressing cell with a higher level in the leading edge. The number in each image indicates the time-lapse in minutes after ligand application, the arrow indicates the direction of ligand application. Scale bars, 20 μm. Each experiment was repeated at least three times and representative images are shown. The time-lapse video clips are available in online (Movies 3 and 4 in supplementary material).

