
Figure 2. Lis1 and Cnn regulate apical and basal spindle pole movements.
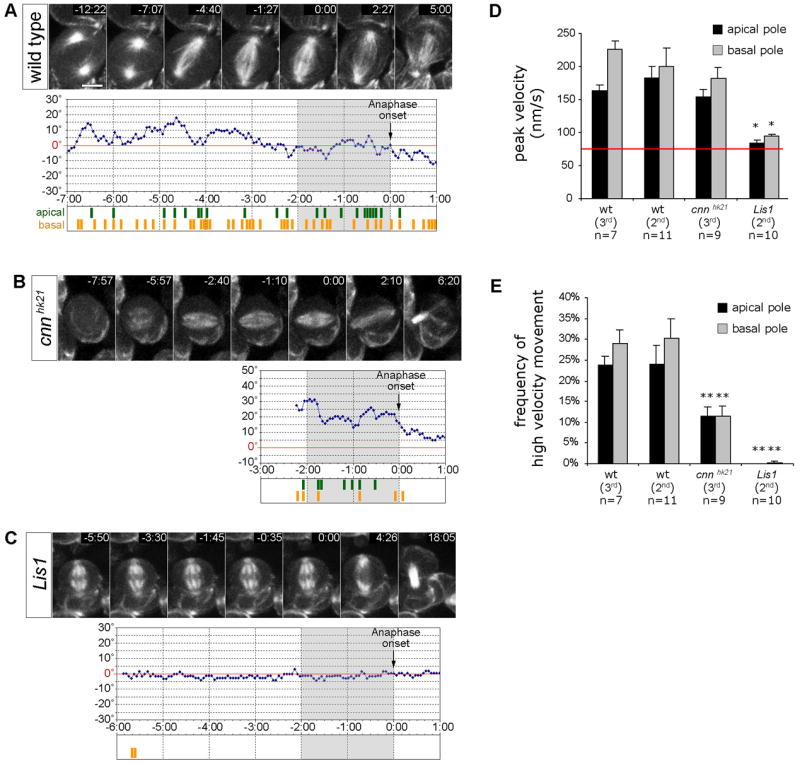
(A–C) Spindle pole movement in larval metaphase neuroblasts expressing the G147-GFP microtubule-associated protein. Time is given in min:sec relatively to the onset of anaphase (0:00). Diagrams depict the angular deviation of the spindle axis at a given time point (blue line) from the final division axis (red line = 0°, determined 5:00 min after anaphase onset). Grey shaded regions indicate the 2 min period of late prometaphase/metaphase prior to anaphase onset (0:00) used for the analysis of spindle pole movements quantified in panels D and E. High velocity movement (≥133 nm/s or ≥2 pixels/frame) of the apical spindle pole (green) and basal spindle pole (yellow) are depicted below each diagram.
(A) In 2nd instar wild type neuroblasts (48h ALH), both apical and basal spindle poles move extensively, causing oscillatory movements of the mitotic spindle around the final division axis. (Movie 3+4). No significant difference was observed between 2nd instar (48h ALH) and 3rd instar (96h ALH) larval neuroblasts (see panels D and E).
(B) In 3rd instar cnnhk21 mutant neuroblasts (96h ALH), apical and basal spindle pole movements with velocities ≥133 nm/s were less frequent than in wild type counterparts. Measurements were started at the time a bipolar spindle with focused spindle poles had formed (Movie 5, see panels D and E).
(C) In 2nd instar Lis1 mutant neuroblasts (48h ALH), spindle pole movements were undetectable or significantly reduced (Movie 6; see panels D and E).
(D+E) Quantification of ‘peak velocity’, and ‘frequency of high velocity movements’ (≥133 nm/s) of apical and basal spindle poles in 2nd instar wild type (48h ALH; n=11), 3rd instar wild type (96h ALH; n=7), 3rd instar cnnhk21 (96h ALH; n=9), and 2nd instar Lis1 (48h ALH; n=10) mutant metaphase neuroblasts. For fair comparison, only the 2 min period prior to anaphase onset (−2:00 – 0:00, indicated by grey shaded diagram areas in panels A–C) was analyzed for each genotype. Depicted are means ± S.E.M. The ‘frequency of high velocity movement’ corresponds to the frequency of time periods during which spindle pole velocity was ≥133 nm/s. This velocity corresponds to spindle pole movement by ≥2 pixels between two consecutive frames; movement by 1 pixel between consecutive frames corresponds to 63–67 nm (red line) and cannot be distinguished from noise. Differences in ‘peak velocity’ and ‘frequency of high velocity movements’ between genotypes were analyzed by Student’s t-tests. Significant differences are indicated (*, p<0.001). Scale bar: 5.