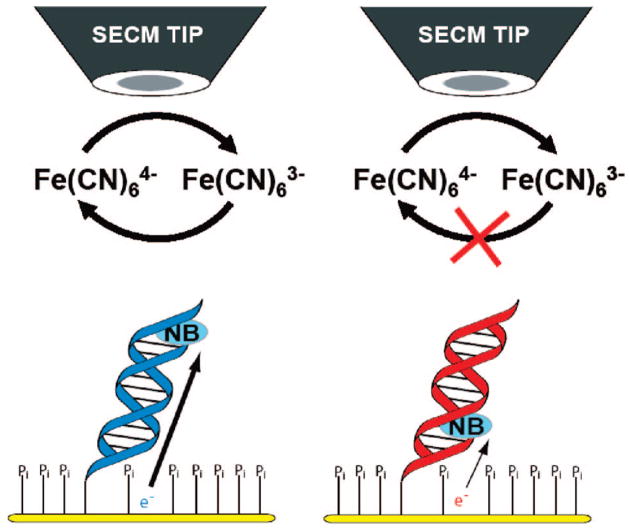
Figure 1.
Schematic illustration of SECM imaging of DNA monolayers modified with Nile Blue (NB) at the top or the bottom; the negatively charged backfilling underlayer is also shown. The sequence was 5′-UGC GTG CTT TAT ATC TC-3′ (top NB) and 5′-TGC GTG CTT TAT ATC UC-3′ (bottom NB), where the italicized U indicates the location of the NB moiety.

