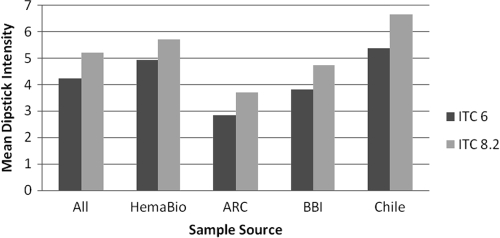
FIG. 2.
Reactivity of ITC6 and ITC8.2 dipsticks with RIPA-confirmed positive sera from several sources. The vertical axis represents the mean dipstick intensity compared to a reference chart showing intensity scale from 0 to 14 (see Materials and Methods). In both cases, the antigen was sprayed on the dipstick at the desired concentration.

