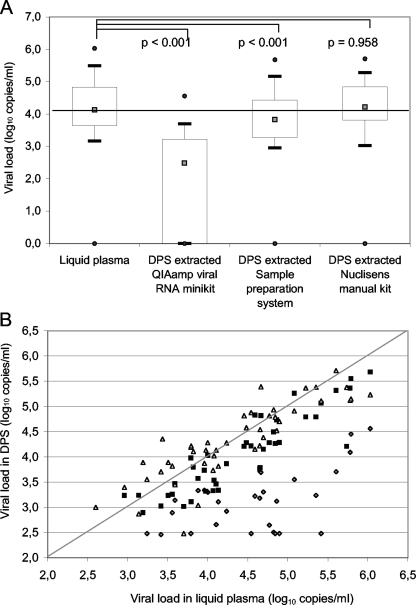
FIG. 1.
HIV-1 viral loads in patient samples (n = 47) of plasma and DPS after RNA extractions with a QIAamp viral RNA mini kit (Qiagen), the Abbott sample preparation system, or a Nuclisens manual extraction kit (bioMérieux). (A) Comparison of median viral loads from DPS with those in matched plasma samples. The gray squares represent medians, the boxes represent interquartile ranges, the whiskers represent lower and upper adjacent values, and the black dots represent outside values. (B) Comparison of viral loads in DPS and corresponding plasmas, only for samples with detectable viral loads, after RNA extraction with Qiagen (gray rhombuses), Abbott (black squares), and bioMérieux (white triangles) extraction kits. Viral loads are expressed as log10 copies/ml. P values were calculated by the Wilcoxon test by comparing liquid plasma and spots.

