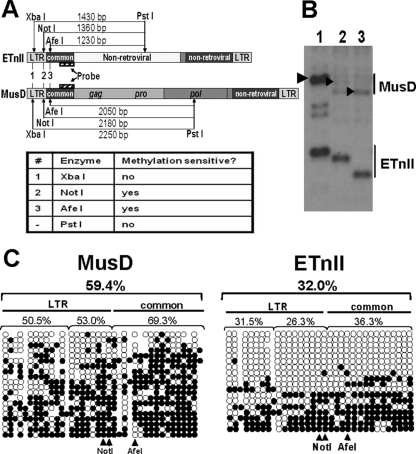
FIG. 3.
Methylation of MusD and ETnII elements in ES cells. (A) Digestion scheme of genomic Southern blotting. Expected fragment sizes and methylation sensitivity of the enzymes are shown. (B) Genomic Southern blotting of the digests. DNA from J1 ES cells was used, and lane numbers correspond to enzyme numbers in panel A. Arrows indicate bands expected to result from digestion of MusD elements. (C) Bisulfite analysis of ETnII and MusD LTRs and common regions. Each horizontal line represents a single clone. Unmethylated CpGs are shown as open circles and methylated CpGs are shown as solid circles. The percentage of methylated CpGs is shown above each of the regions. CpGs in NotI and AfeI sites in ETnII and MusD sequences are shown below. Note that NotI encompasses two CpGs. For reference, a MusD AC084696 sequence was chosen. Because the population of ETn and MusD sequences is heterogeneous, some CpG dinucleotides are lacking in select copies. In those cases, circles representing the CpG were omitted. Conversely, if a CG was present in the bisulfite-treated clone but not the reference sequence, we added a closed circle depicting a methylated CG, which corresponds to a gap in the reference sequence. The number of unmethylated CpGs is an underrepresentation, since methylated CpGs were plotted regardless of their presence in the reference sequence, while we had no means of determining whether a TG identical to the reference sequence was an unmethylated CG or a true TG in the genomic copy.

