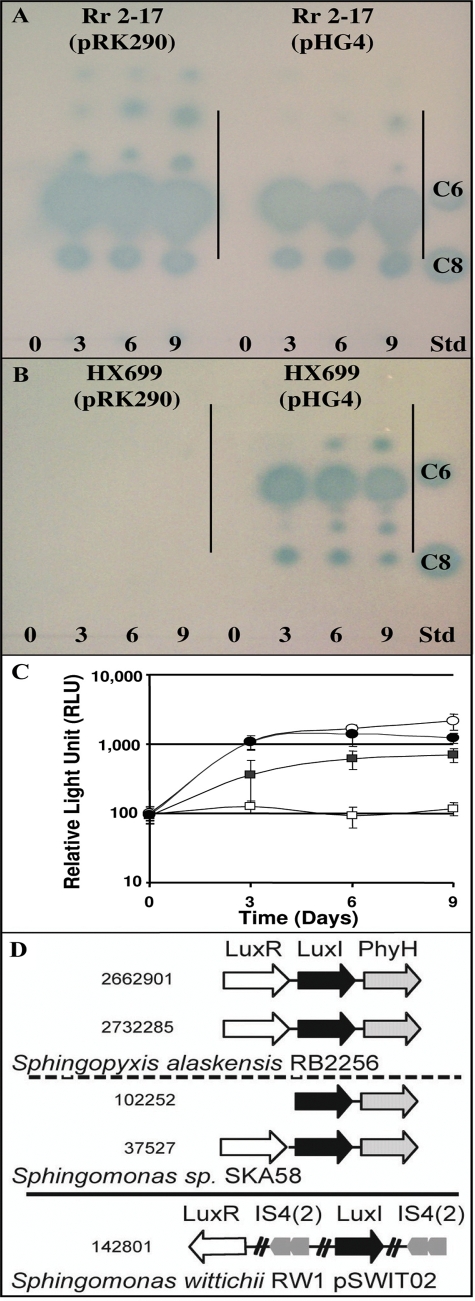
FIG. 6.
(A to C) Analysis of QS molecules from Rr 2-17 and Hx 699 grown on rich PD agar (A and B) and estimation of total accumulated AHL signals detectable with a LuxR-dependent biosensor (C). (A) AHL signal accumulation in Rr 2-17(pRK290) and Rr 2-17 with extra copies of rsh on pHG4 at 0, 3, 6, and 9 days. The culture extract applied per lane is equal to 40 μl of culture supernatant. AHL standards of C6-HL (100 pmol) and C8-HL (33 pmol) are included in the standard lane (Std). The origin of loading is indicated. (B) AHL signal accumulation in Hx 699(pRK290) and complemented Hx 699(pHG4) at 3, 6, and 9 days. (C) Quantification of AHL signal accumulation in aEtOAc extracts of Rr 2-17(pRK290) (open circles), Rr 2-17(pHG4) (solid circles), Hx 699(pRK290) (open squares), and Hx 699(pHG4) (solid squares) at 0, 3, 6, and 9 days. The same samples were used in the TLC assays (A and B). The extract assayed was equivalent to 400 μl of culture supernatant. The experiment was repeated three times, and the mean values and standard errors are shown. (D) Alignment of gene context/neighborhoods around luxI homologs in the sequenced genomes of the Sphingomonadales order. Genes that have conserved neighborhoods are shown by boxed arrows, and the direction of the arrow indicates the transcriptional direction. Names of representative encoded protein are given, as are the species in which it is present and the approximate nucleotide location number of each LuxI (solid black arrows). Broken cross lines in the S. wittichii RW1(pSWIT02) LuxI gene context indicate intervening regions contain additional genes.

