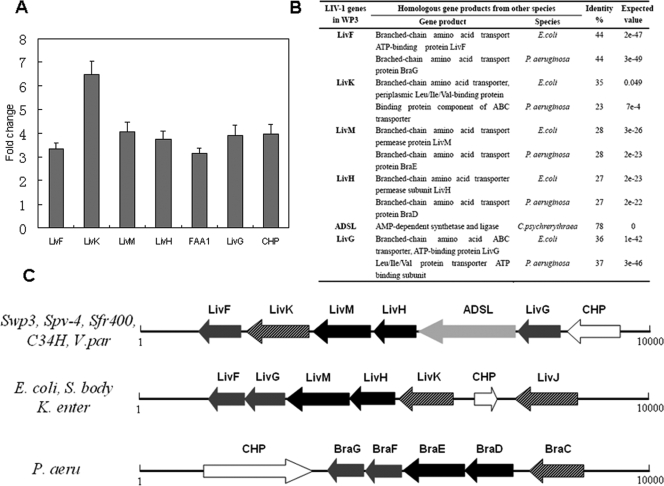
FIG. 5.
(A) LIV-I gene expression levels in WP3. Upregulation of the BCAA ABC transporter gene cluster (LIV-I) at low temperature is shown. Gene expression level changes of the LIV-I system were monitored by real-time RT-PCR as discussed in Materials and Methods. The gene expression level at 20°C was set as 1, and the change represents the gene expression level at 4°C compared to the level at 20°C. The error bars indicate standard deviations. (B) The genes of the LIV-I system in WP3 are compared with the corresponding homologous genes in the two well-characterized bacteria E. coli and P. aeruginosa. (C) Organizations of BCAA ABC transporters (LIV-I) in different bacteria. The open reading frames (ORFs) are represented by arrows oriented in the direction of transcription. The putative gene product of each ORF is shown. The extracellular solute binding proteins (LivJK and BraC) are represented by hatched arrows, the integral membrane proteins (LivHM and BraDE) are represented by black arrows, and the ATPase components (LivFG and BraFG) are represented by gray arrows. Additionally, the arrow labeled ADSL represents the AMP-dependent synthetase and ligase, and the white arrows represent the conserved hypothetical protein (CHP). S. body, Shigella bodyii Sb227; K. enter, Klebsiella enterica; Swp3, S. piezotolerans WP3; Spv-4, Shewanella sp. strain PV-4; Sfr400, S. frigidimarina NCIMB 400; C34H, Colwellia psychrerythraea 34H; P. aeru, P. aeruginosa; V. par, Vibrio parahaemolyticus RIMD 2210633.

