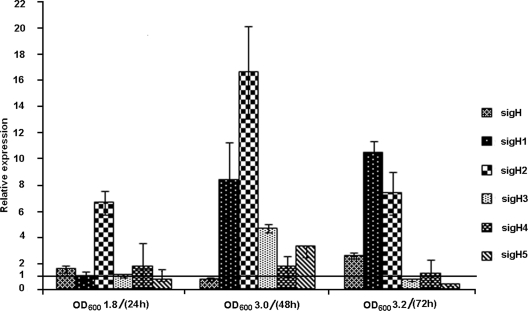
FIG. 2.
Relative levels of expression of sigH paralogs at the late log (optical density at 600 nm [OD600] of 1.8), stationary (OD600 of 3.0), and extended stationary (OD600 of 3.2) phases. Expression levels of sigH paralogs at early log phase (OD600 of 0.5) were considered controls (line at 1 on the y axis). sigH6 and sigH7 transcripts were far below the control level.

