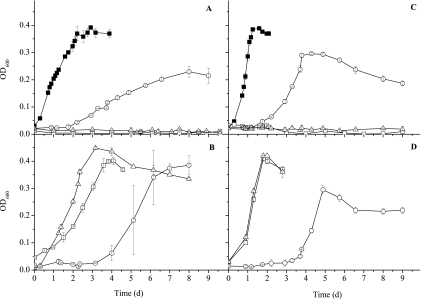
FIG. 2.
Growth curves comparing the D. desulfuricans G20 parent (▪), mopB mutant (□), cycA mutant (▵), and hydB mutant (○) grown in MS medium containing 50 mM sulfate with 110-kPa partial H2 pressure in the headspace (A and B) or 50 mM formate (C and D). Panels A and C show data for transposon mutants and the parental strain, and panels B and D show data for complemented mutants. All the values are means of two measurements with average deviations.

