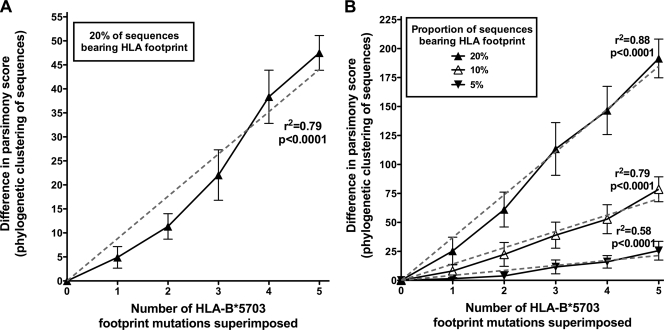
FIG. 7.
Model to show difference in phylogenetic clustering as five HLA-B*5703 footprint mutations were superimposed on Gag sequences. Each panel shows the mean difference in parsimony score between trees with no mutations and trees built from the same taxa with sequential HLA-B*5703 footprint mutations superimposed. Addition of mutations increases the difference in parsimony scores, reflecting progressive phylogenetic clustering (error bars show 95% confidence intervals; r2 from linear regression with the y intercept set to go through the origin). (A) One hundred Gag sequences were selected at random from HLA-B*5703-negative individuals and used to construct an NJ phylogenetic tree. Five characteristic HLA-B*5703 footprint mutations were added, one at a time, to 20 sequences in each tree. Twenty repetitions are shown. (B) All 526 taxa from HLA-B*5703-negative subjects were used. The footprint mutation was added to a varying proportion of sequences (individual sequences selected at random). Ten repetitions are shown.

