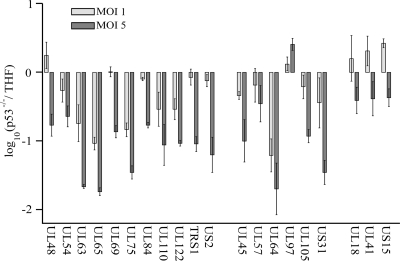
FIG. 2.
q-PCR experiments conducted at 24 hpi on 20 viral genes at MOIs of 1 (light shaded bars) and 5 (dark shaded bars) in THF and p53−/− cells. Each bar represents the average from two independent experiments, and error bars indicate the minimum and maximum values of the single measurements. The expression of the first 11 genes (UL48 to US2) was shown to be significantly different in the microarray experiments, while the 6 genes in the middle group (UL45 to US31) were chosen to verify the results of the ChIP experiments performed by our group previously (41). The three genes in the last group (UL18 to US15) served as control genes, with no p53 BS within 3 kb of the start codons. The ordinate is scaled in a log10 manner, with negative values indicating downregulation in p53−/− cells.

