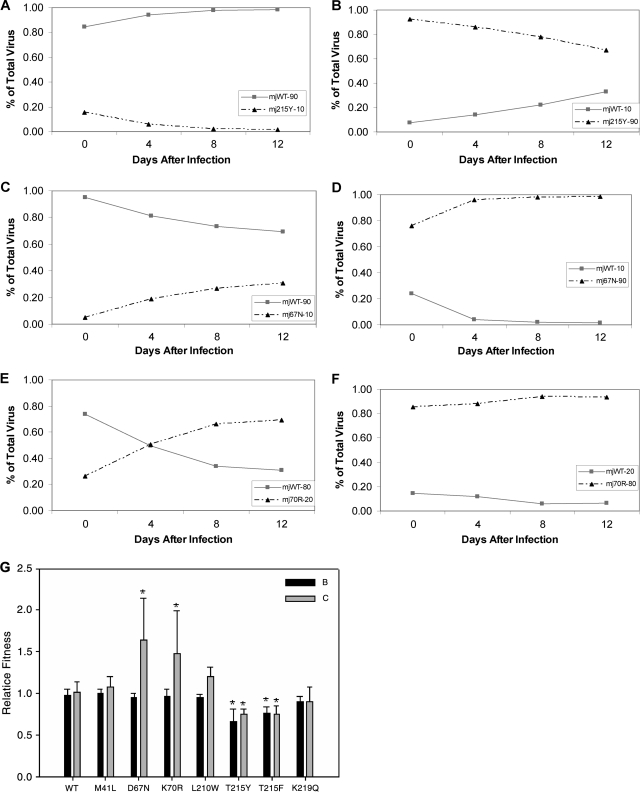
FIG. 2.
(A) Competition with the subtype C WT (mjWT) and the 215Y mutant (mj215Y) with an initial inoculum of 90% WT to 10% mutant. (B) Reciprocal of panel A, with 10% WT to 90% 215Y. (C) Competition of the subtype C WT with the 67N mutant at a ratio of 90:10. (D) WT and 67N mutant at a ratio of 10:90. (E) 70R competition at a closer initial inoculum of 80% WT to 20% 70R. (F) Opposite of panel E, with 20% WT to 80% 70R. (G) Summary of all single-mutant competitions. Relative fitness is defined in Materials and Methods, and each mutant was competed with its subtype-specific WT. The bars represent the means, and the error bars are 1 standard deviation. The bars marked with asterisks are significantly different from the WT value according to the Mann-Whitney rank sum test, with a P value of less than 0.01.

