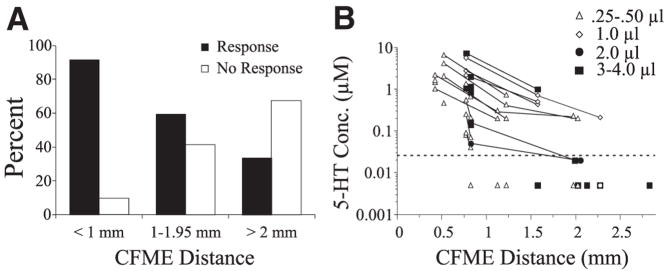
FIG. 3.
Spread of 5-HT (100 μM) through the spinal cord measured at different distances from the site of microinjection. A: percentage of CFMEs that showed a 5-HT oxidation current (response vs. nonresponse). CFMEs were positioned <1 mm away (Close), between 1 and 2 mm away (Intermediate) or ≥2 mm away (Far) from the injection site. B: concentration of 5-HT detected as a function of distance. Symbols to the right denote volume of injected 5-HT (0.25– 4.0 μl). Responses of CFMEs during the same experimental trial are connected with a solid line. Note that the concentration diminishes rapidly with increasing distance. Observations below average detection threshold (dotted line) indicated at “0.005 μM” are included, providing that 5-HT was detected with other electrodes in the same trial.

