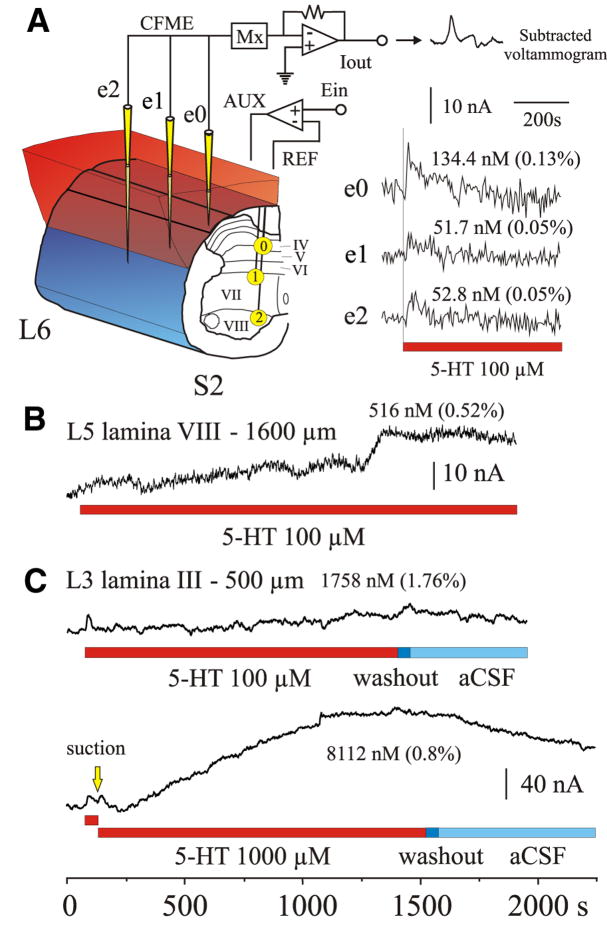
FIG. 5.
5-HT superfusion of the dorsal surface of the spinal cord. A, left: 3 CFMEs (yellow) were positioned in caudal spinal segments L6, S1, and S2. Electrodes were placed into laminae IV (e0), VII (e1), and VIII (e2). Shortest distance from the CFME tip to the spinal cord surface exposed by the laminectomy was 600, 900, and 1,350 μm for e0, e1, and e2, respectively. Right: shortly after application of 100 μM 5-HT, concentrations increased within the spinal cord as determined by oxidation of 5-HT at all CFMEs (see sample voltammogram). Peak oxidation current amplitude is plotted for each electrode. This early response peaked within 4–12 s of application and gradually returned to baseline. Maximum concentrations and percentage of applied 5-HT concentration are indicated. Time of exposure to 5-HT in all panels is indicated by the red bar. B and C: peak oxidation current amplitude plots from 2 other experiments illustrating changes in 5-HT concentration (both early and late responses) to superfusion with either 100 or/and 1,000 μM 5-HT. Note the gradual increase in concentration with time after the initial response. A drop in concentration (C) was observed after washout. Washout of 5-HT is indicated by dark blue bar; artificial cerebrospinal fluid (aCSF) bathing medium indicated by light blue bar. Locations and electrode depth (from closest exposed surface area) are indicated, as is the peak concentration of 5-HT for the late response. Bottom trace shows that the early response could be reproduced with a second application of 5-HT [removed by suction (yellow arrow) between applications].

