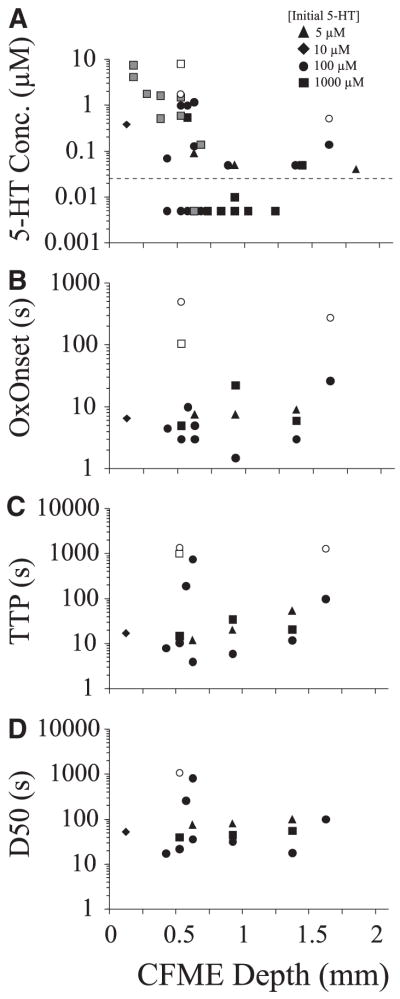
FIG. 6.
Response of CFMEs placed at various depths within the spinal cord to bath superfusion of 5-HT. Concentration detected (A), OxOnset (B), TTP (C), and D50 (D) are plotted relative to CFME depth from the closest exposed surface of the spinal cord. Symbols to the right denote concentration of applied 5-HT (5–1,000 μM). Closed symbols denote initial (early) responses; open symbols denote second (late) responses. For concentration detected, observations below average detection threshold (dotted line) indicated at “0.005 μM” are included, providing that 5-HT was detected with other electrodes in the same trial. In one experiment, electrodes in ventral locations were repositioned to more dorsal locations to obtain concentration measurements (gray symbols) and it was not known whether the values were from an early or late response.

