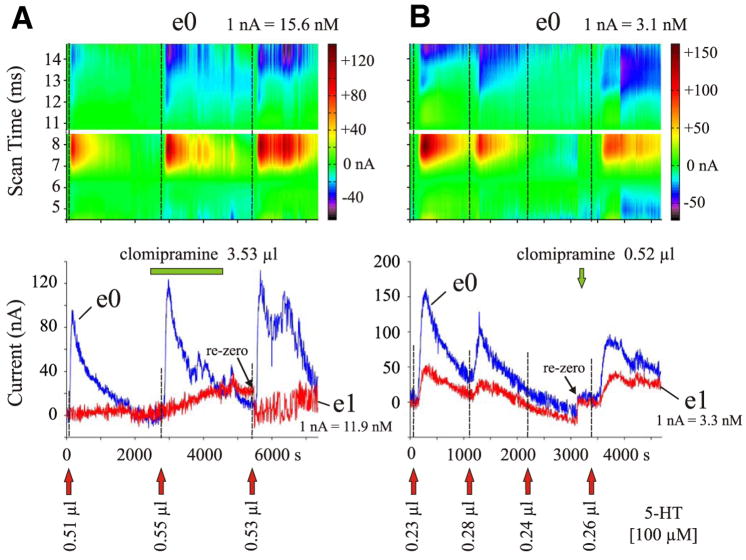
FIG. 7.
5-HT peak oxidation currents of individual CFMEs before and after microinjection of clomipramine. A: 5-HT concentrations were measured with 2 electrodes, located 400 μm away (e0) and 1,150 μm away (e1) from the 5-HT and clomipramine micropipettes, in lamina III of spinal segment L6. Top: color raster plots of 5-HT redox currents for e0. Bottom: plot shows maximum peak oxidation currents for both electrodes. Microinjection of 3.53 μl clomipramine (100 μM) was preceded by one and followed by 2 separate 5-HT microinjections. Red arrows indicate when 5-HT (100 μM) was microinjected (0.50 μl/min each); the green bar indicates time of clomipramine application (0.1 μl/min). Note increase in amplitude and prolongation of response to 5-HT after clomipramine. B: microinjection of 0.52 μl clomipramine (10 μM, 0.5 μl/min; green arrow) preceded by 3 and followed by one 5-HT microinjection (100 μM, 0.25 μl/min; red arrows). In this experiment, CFMEs were located 750 μm away (e0) and 834 μm away (e1) from the 5-HT micropipette (located between the CFMEs in a fixed array), in lamina V of spinal segment L2. Clomipramine ejection electrode was positioned 400 μm away from e0 and 1,950 μm away from e1. Plots as in A. Repeated 5-HT microinjections given in close succession showed diminishing responses that were reinstated with administration of clomipramine.

