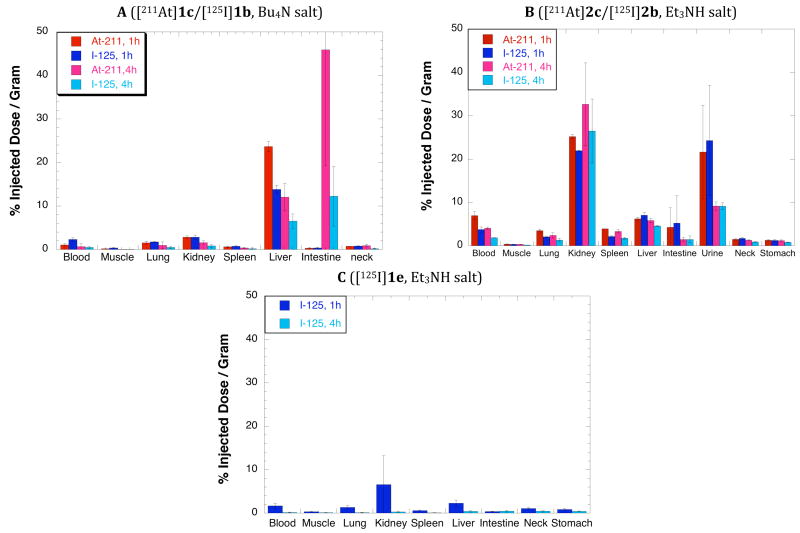
Figure 3.
Graphed data from tissue biodistributions in mice at 1 and 4 hours after injection of (Panel A) nBu4N salt of 2-propylamido-closo-decaborate(2-) labeled with 211At ([211At]1c) / 125I ([125I]1b); (Panel B) Et3NH salt of 2-propylamido-closo-dodecaborate labeled with 211At ([211At]2c] / 131I ([125I]2b); and (Panel C) Et3NH salt of 2-propylamido-closo-decaborate (2-) labeled with 125I ([125I] 1e). Red bars represent concentration of 211At at 1h post injection (pi), pink bars represent concentration of 211At at 4h pi, dark blue bars represent 125I at 1h pi, and light blue bars represent 125I at 4h pi. Data has been plotted on the same scale for all 3 graphs for comparison purposes.

