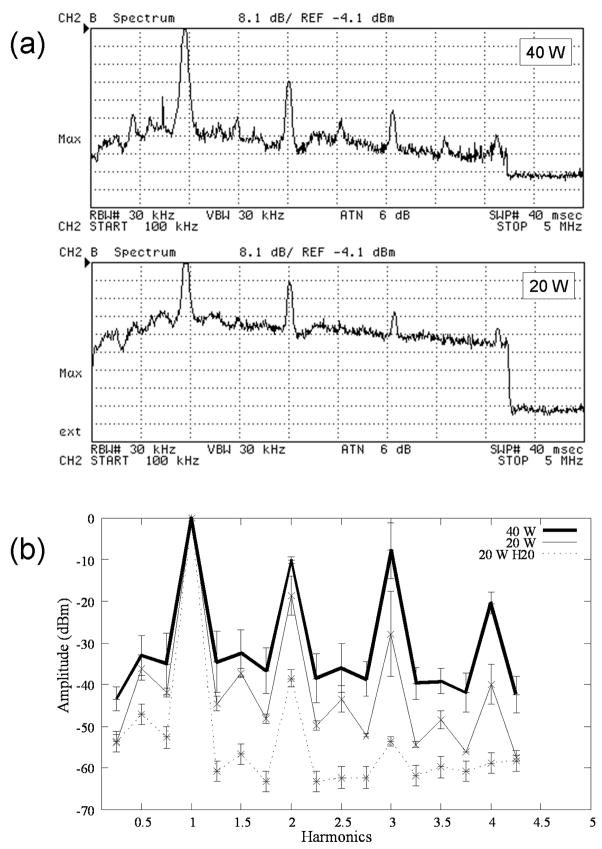
Fig. 7.
(a) Spectra collected during treatments at 40 W and 20 W TAP. The spectra give the maximum value measured over 40 pulses, at a single raster point. The trailing edge at far right is outside of the pulse, and thus represents the level of system noise. The sweep runs from 0.1 to 5 MHz, and each y division represents 8.1 dB below the reference level of −4.1 dBm. (b) Representation of normalized (with respect to fundamental) spectra at 40 and 20 W TAP; 20 W H2O is the spectrum in degassed water for comparison.

