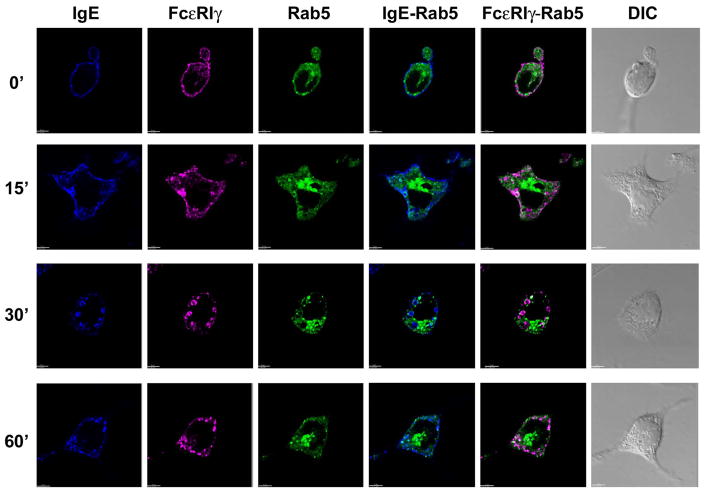
Fig. 2. Endosomal localization of FcεRIα and -γ chains in RBL-2H3 cells over-expressing EGFP-tagged Rab5.
RBL-2H3 cells were transfected with EGFP-tagged Rab5 (green), stimulated, stained for IgE with streptavidin AlexaFluor 405 (blue) and for FcεR1γ with rabbit anti-FcR γ antibodies followed by secondary goat-anti-rabbit IgG-AlexaFluor 647 tagged antibody (magenta), and visualized by confocal microscopy following addition of DNP-HSA as described in Materials and Methods. At least 10–20 cells at each time point from three independent experiments were imaged. DIC images are shown in grayscale for all selected cells. The overlap between green and magenta channels results in white spots and the overlap between the green and blue channels results in cyan spots. Scale bar, 5 μm.

