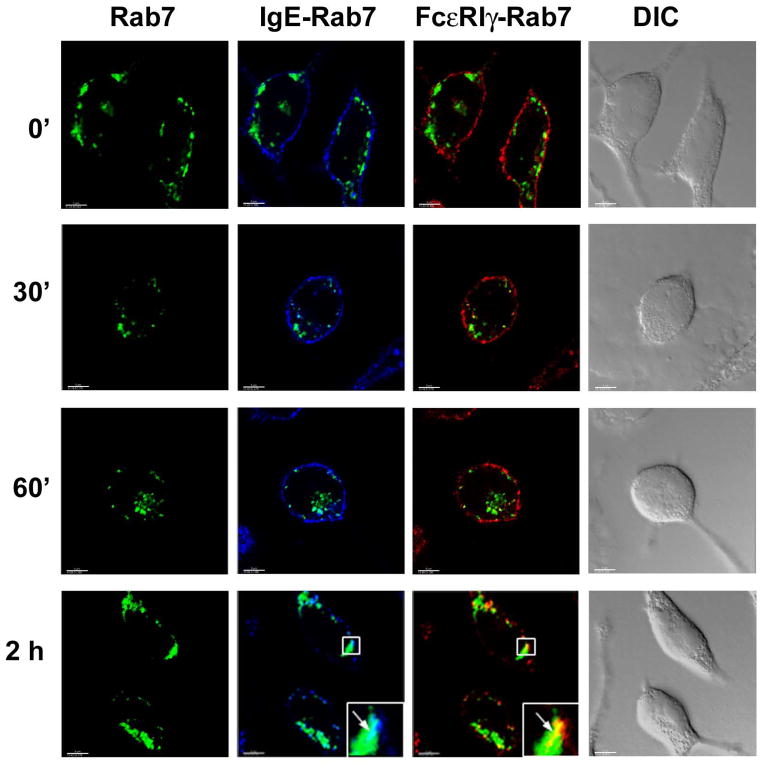
Fig. 4. Localization of FcεRIα and -γ chains in RBL-2H3 cells over-expressing EGFP-tagged Rab7.
RBL-2H3 cells were transfected with EGFP-tagged Rab7 (green), stimulated, stained and visualized by confocal microscopy as described in Materials and Methods. IgE-bound FcεRIα chain was detected with streptavidin AlexaFluor 405 (blue), FcεRIγ was detected with a combination of anti FcR γ chain Ab and secondary goat-anti-rabbit IgG-AlexaFluor 594 (red) tagged antibody. IgE-bound FcεRIα and FcεRIγ chains are shown as merged images with EGFP-tagged Rab7. Squares show areas of cells shown in higher magnification in the lower right corner of selected panels. Arrows indicate subcellular structures with co-localization of fluorescent labels. Yellow spots indicate co-localization of the red and green colors and cyan staining indicates co-localization of the green and blue colors. At least 10–20 cells at each time point from three independent experiments were imaged. DIC images are shown in grayscale. Scale bar, 5μm.

