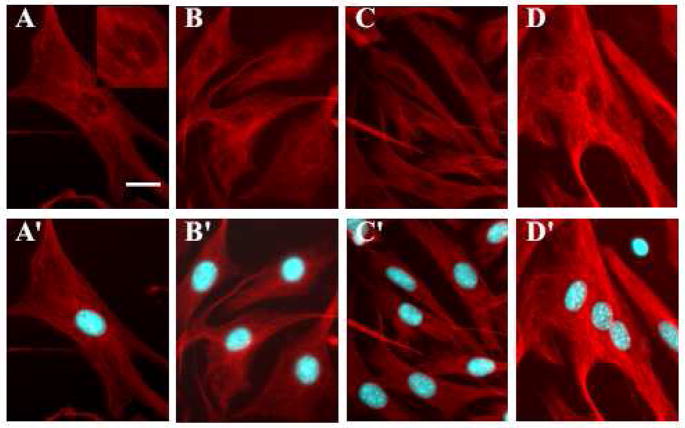
Figure 3.
Syncytium formation is accompanied by restructuring of microtubule network and loss and relocation of MTOC.
To explore the changes in the structure of microtubule skeleton during cell-cell fusion, the fusing cells were fixed at different times after low pH application. Microtubules were labeled in red with mouse anti-alpha tubulin antibody (with alexa594 donkey anti-mouse antibody as secondary antibody) and nuclei were labeled in blue with Hoechst. (A, A′) the negative control without low pH application. (B–D and B′–D′) Images were taken at t=5 min (B, B′); 10 min (C, C′); and 125 min (D, D′) after the beginning of low pH application. For each pair of images, the second image (images A′, B′, C′, D′) includes the superimposition of the nuclei, which helps in distinguishing single and multinucleated cells, and clarifying the position of the nuclei in the syncytia, but can hide the MTOC. Scale bar, 25μm.

