
Figure 5. Snail associates with the ER-α locus.
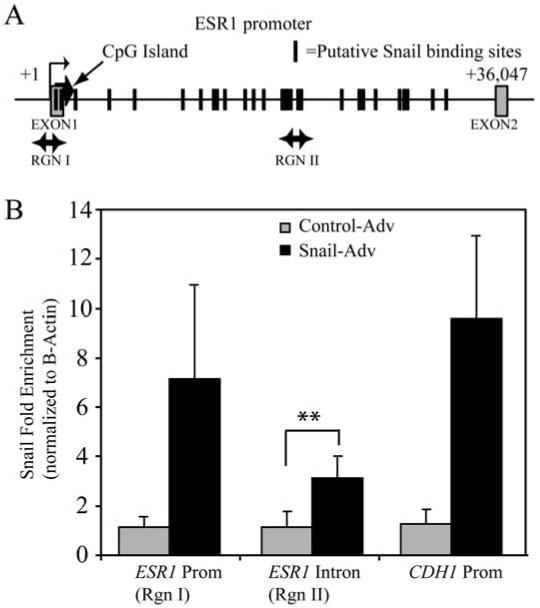
(A) Schematic of the ER-α locus showing location of the primer sets used in ChIP analysis. The boxes represent the exons, while the hash marks represent clusters of putative Snail binding sites. (B) MCF-7 cells were infected with Snail or control adenovirus and ChIP performed as described in materials and methods. Amplification of input and DNA precipitated with either a control IgG or anti-Snail antibody is shown for the indicated primer sets. The data represent fold-change of material immunoprecipitated with the Snail antibody versus with IgG, and normalized to Snail binding at the beta-Actin intron, which has no known Snail binding sites.