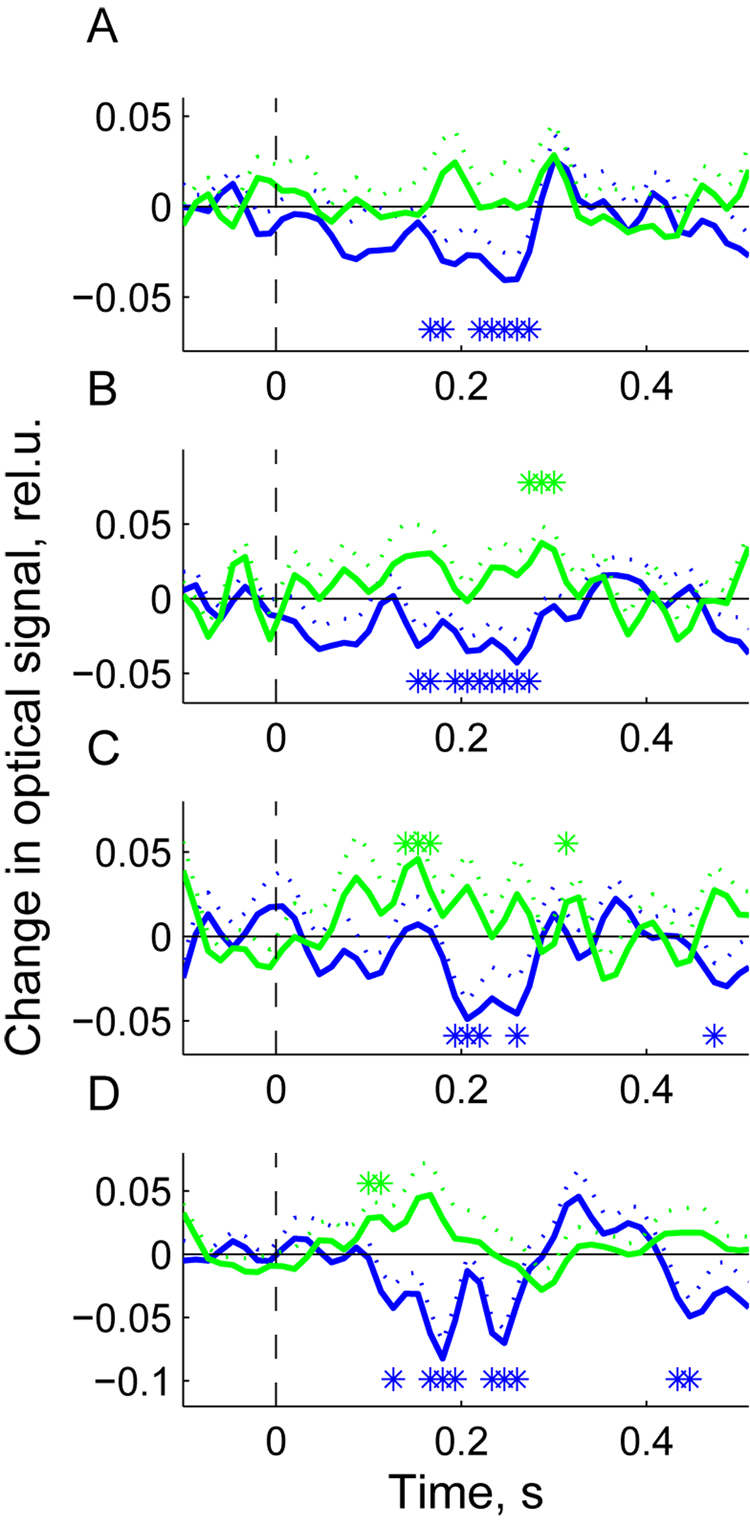
Fig. 6.
Group average event-related responses for presentation rate (PR) = 6 Hz and wavelength = 760 nm, N = 8 (A); PR = 6 Hz and wavelength = 830 nm, N = 10 (B); PR = 4 Hz and wavelength = 760 nm, N = 7 (C); PR = 4 Hz and wavelength = 830 nm, N = 7 (D). N is the number of subjects used in each of four conditions to derive the group average response. Only subjects showing a significant response were used in group averaging. Stimulus is presented at t = 0 (picture onset). Blue line – response to targets; green line – response to non-targets; dotted lines show standard errors for the corresponding signals at each time point; asterisks designate time bins with significant deviation of responses from baseline (t-test, p < 0.05). Signal amplitude scale is in units of ΔI/I0 (%).

